Welcome to the user guide page for ONEOF Accuracy Pro.
Preparing the App and the Watch
Download and Install ONEOF Accuracy App
Download and install the ONEOF Accuracy App for Windows. The minimum requirements are:
- Windows 10 version 1803 or greater
- 64 bits
- Processor Intel i5 or more
- 4Go RAM or more
Note: The Accuracy Pro is also compatible with the iOS and Android ONEOF Accuracy Apps.
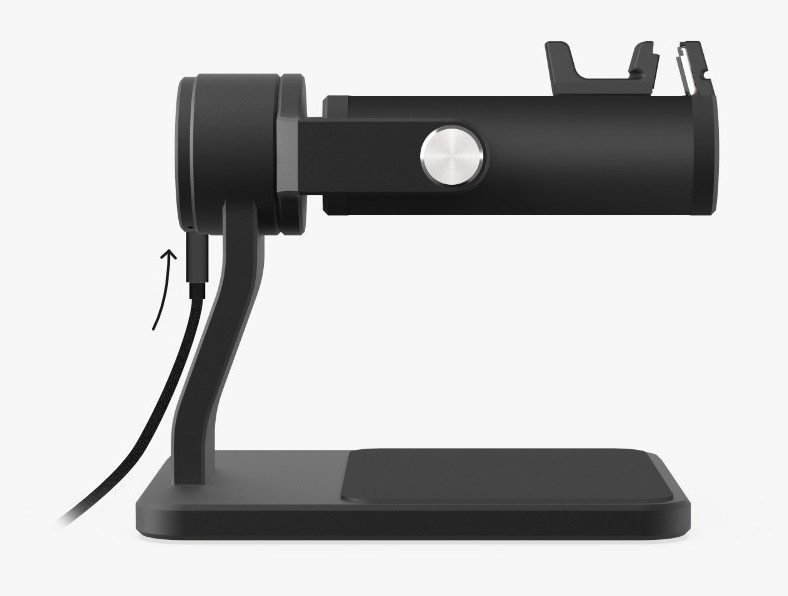
Connect Device
Plug the USB type-C cable in the device. The connector is located along the stand.
Note: Always use high-quality shielded USB cables only.
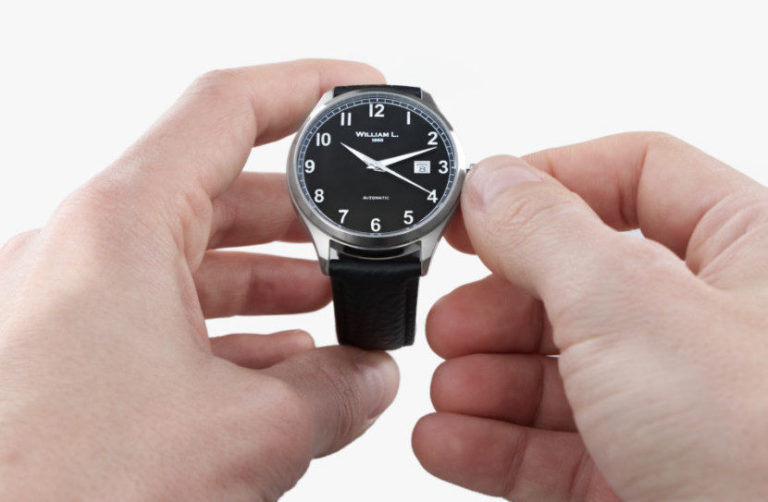
Wind Up Watch
If the watch is equipped with a screw-down system, always unlock the crown. Otherwise the signal could be too weak to be correctly processed. Fully wind the watch by turning the crown clockwise.
Place The Watch
Hold the linear slide and place the watch on the device. The crown should lay on the fine brushed aluminum part.
Note: The crown in contact with the sensor always gives the best signal quality.

For Heavy Watches
You can secure the watch by placing the dedicated rubber strap around the slide and the sensor cap. You will find two rubber straps under the stand of the device.

Plug & Play
Start the ONEOF App and plug the device into the computer. Windows will install and configure the device automatically. After a few seconds, the Accuracy Pro icon will appear on the left menu. The device is ready for the first measurement!
App Overview
At a Glance
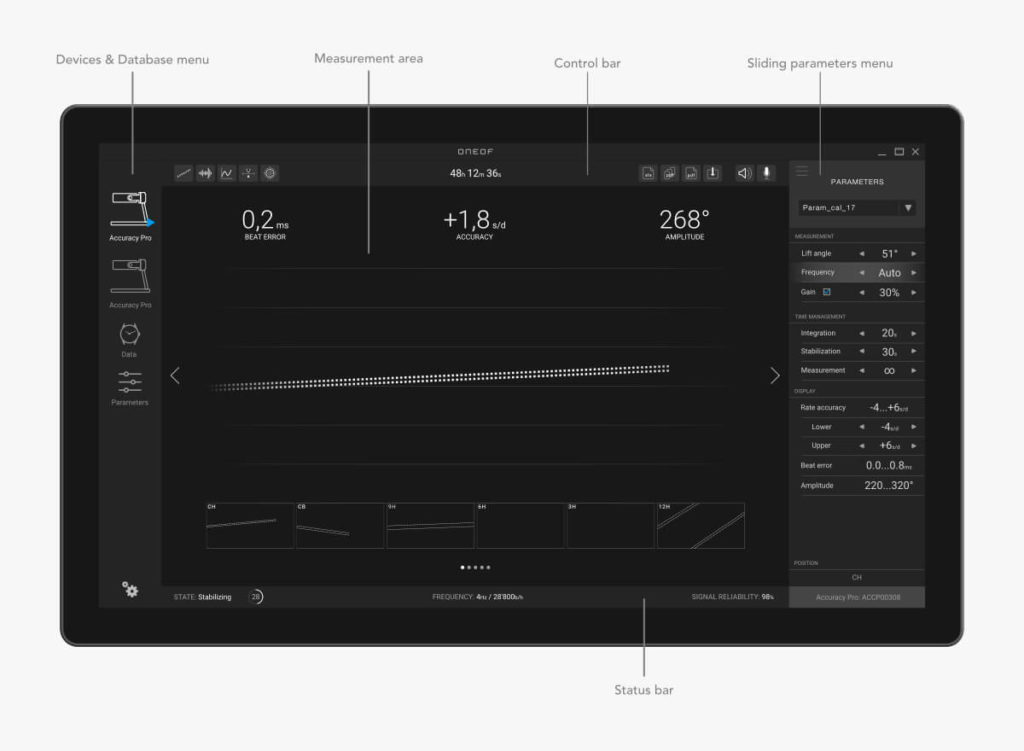
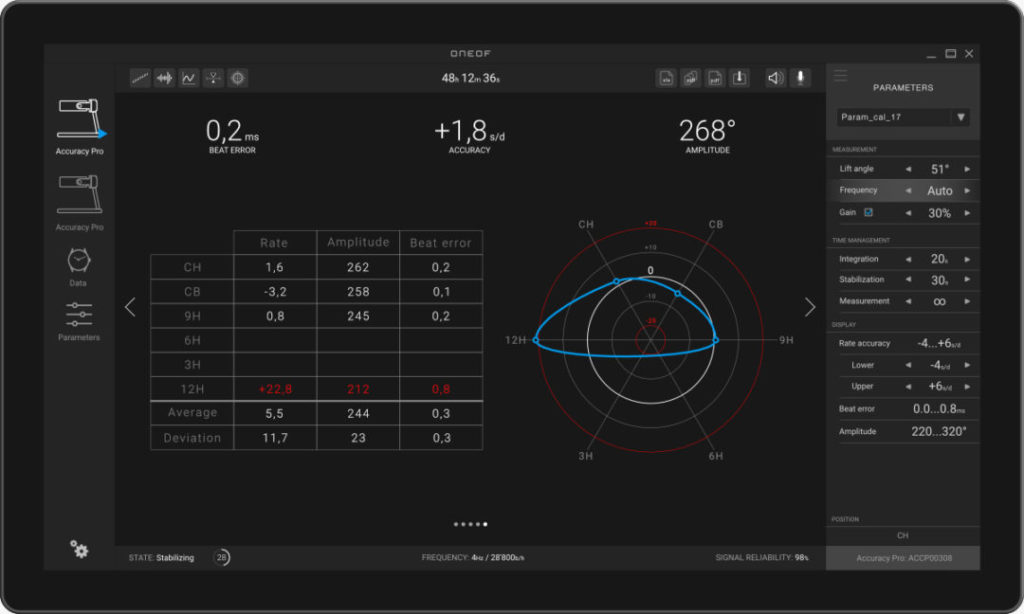
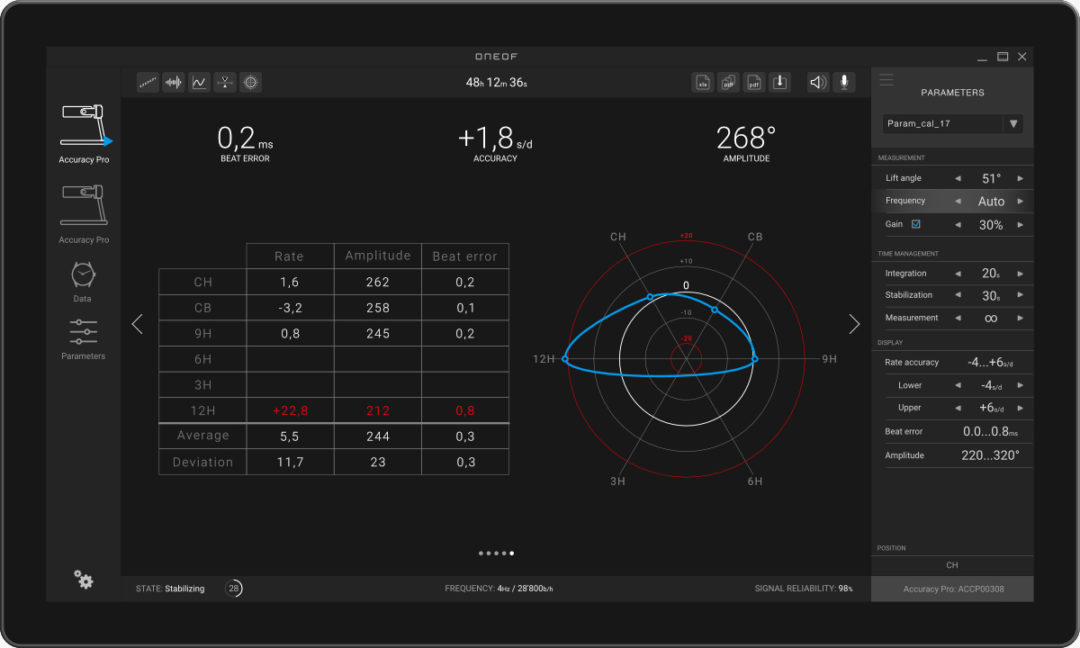
The ONEOF Accuracy app window is organized into different areas: menu and bars. The main window is dedicated to the measurement results. The measurement parameters are always readily available through a sliding menu. The app is responsive and tactile (compatible with tablets).
- Main menu: Navigate through all the plugged devices, the measurement results and parameters databases.
- Control bar: Includes the buttons to navigate through the different measurement displays, to activate / deactivate the speaker / recorder mode or to export / save the data.
- Status bar: Shows the current status of the measurement, the frequency of the watch and the quality of the signal.
- Sliding parameters menu: Includes all the measurement parameters, a list to access a user parameters, the display options, the current device orientation and serial number.
- Measurement area: Where all the measurements results are displayed.
The Main Menu
Fixed menu located on the left of the window, it allows the user to navigate through the different plugged devices in order to display the measurement results. It also contains the results database, the parameters database and the main app settings.

The Measurement Windows
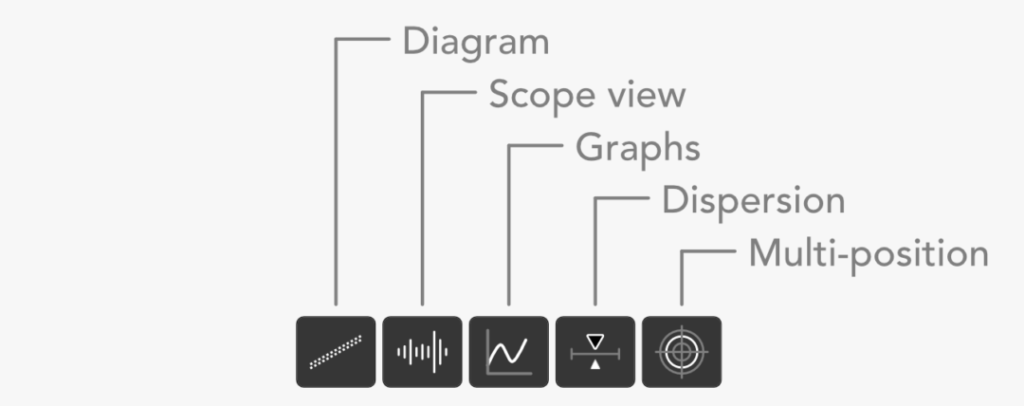
The main measurement results – the rate accuracy, the beat error and the amplitude – are always readily available at the top of the main window. The control bar left buttons navigate through different displays: the diagram, the scope, the graphs, the dispersion, the tabular data and the radar chart (multi-position). The navigation is also possible through the two arrows located on the left and on the right of the window.

The Parameters Menu
The measurement parameters are always available through a sliding menu located on the right of the window. It includes a list with the saved user parameters, the current measurement settings, the time management, the display options and the device orientation and serial number.
Performing a Measurement
The Measurement States
The app has no start / stop button: the measurement starts automatically as soon as a watch is detected on the sensor. When a watch is detected, the measurement goes through different states depending on the set parameters:
- Detecting frequency (if set automatic)
- Stabilizing (if non-zero)
- Integrating
- Measuring
- Finished or Failed
The current state is displayed at the bottom left of the window with its full name and optionally a countdown.

The Frequency Detection
By default, the beating frequency of the watch is automatically detected in one second. When detected, the value appears at the center of the status bar (bottom of the window). It is displayed in both Hertz [Hz] and beats-per-hour [b/h] units.

The Diagram Display
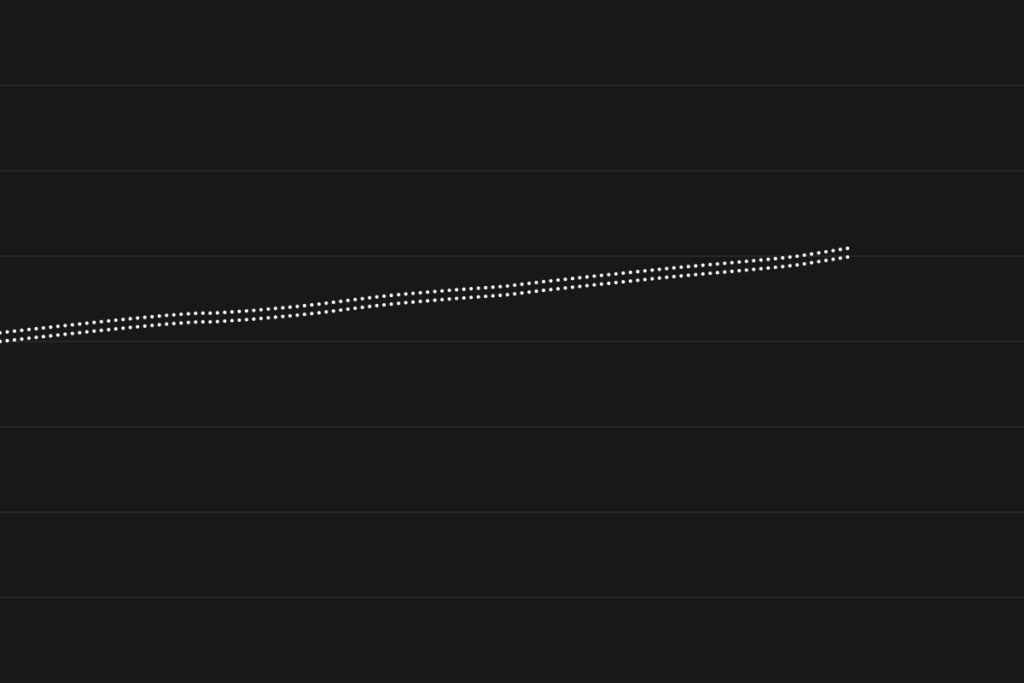
As soon as the frequency is detected, the diagram starts displaying the results. Each dot represents a tick or a tock over time which results in the shape of two lines.
- If the watch tends to run faster, the slopes are positive.
- If the watch tends to run slower, the slopes are negative.
- If the watch is perfectly accurate, the chart displays flat lines.
In case the watch has no beat error, the two lines are superimposed. If the beat error is greater than 0.0ms, the lines are spaced. The bigger the beat error, the larger the space between the lines.

When the orientation of the device is changed, the app keeps a history of the diagram for each common orientations (CH, CB, 9H, 6H, 3H, 12H).
The diagram display is historically and commonly used by all the watchmakers as it gives a straight visual results of the watch behavior.


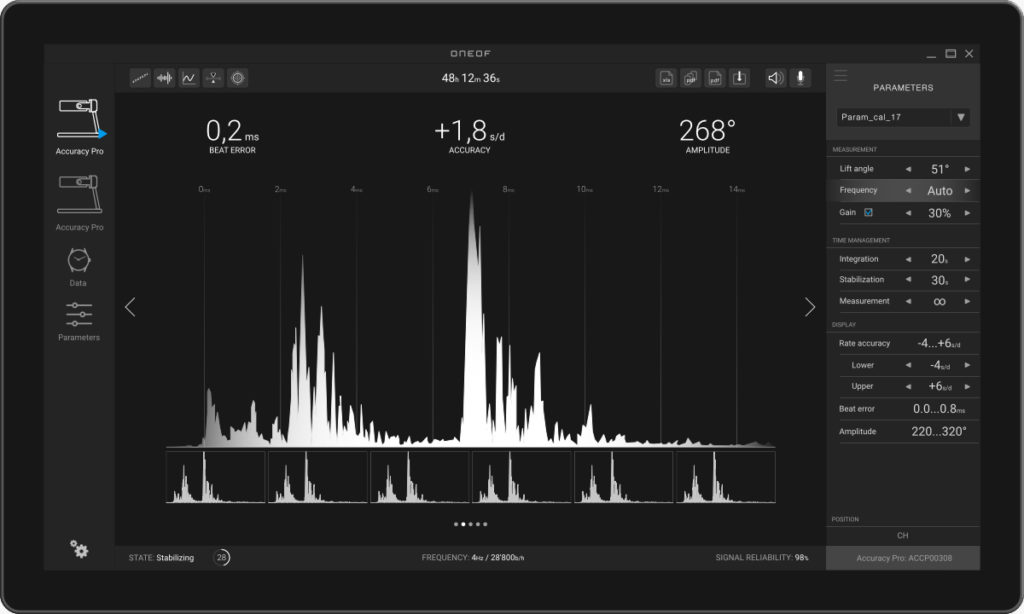
The Scope Display
The scope is the graphic display of the ticking signal of the watch movement. From the scope, expert watchmakers can detect problems in the escapement phase. It is also a very useful tool to determine if the coming signal is good enough for a correct measurement of the watch.
The Swiss lever escapement is composed of 3 distinctive pulses. The first pulse is temporally very precise and therefore it is used for the computation of the rate accuracy and the beat error. The second pulse is very irregular and cannot be used. The third and most powerful pulse is used to estimate the amplitude of the balance wheel.
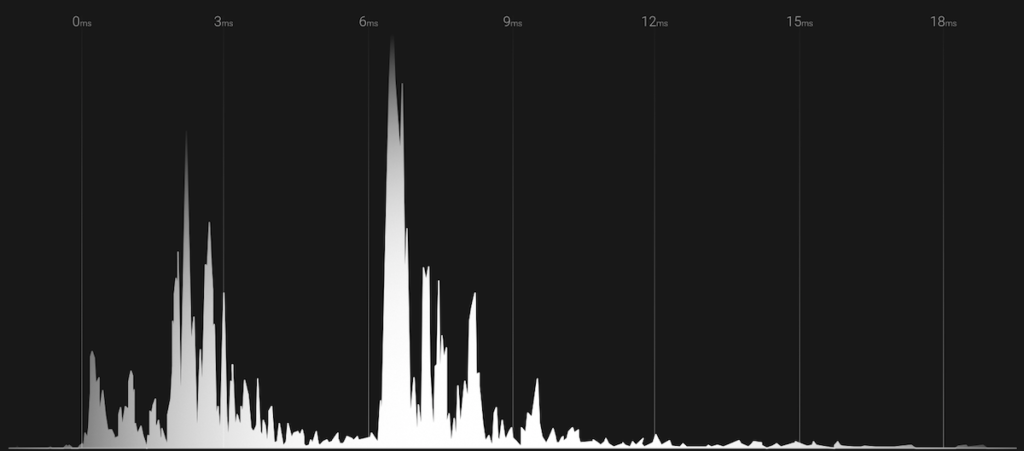
Below the main scope view, the app displays the last 6 beating noises. They are automatically refreshed, starting from the left to the right.

The Main Results
When the integration time is over, the state switches to Measuring and the measurement results are displayed at the top of the measurement area. The rate accuracy is displayed in seconds per day [s/d] at the center, the beat error in milliseconds [ms] on the left and the amplitude in degrees [°] on the right. Each of these values are updated every second.

When the first results are available, a time counter starts and is displayed at the center of the control bar.
Note: In case the user set a specific measurement time (infinite by default), the time counter is displayed as a countdown until the measurement stops.

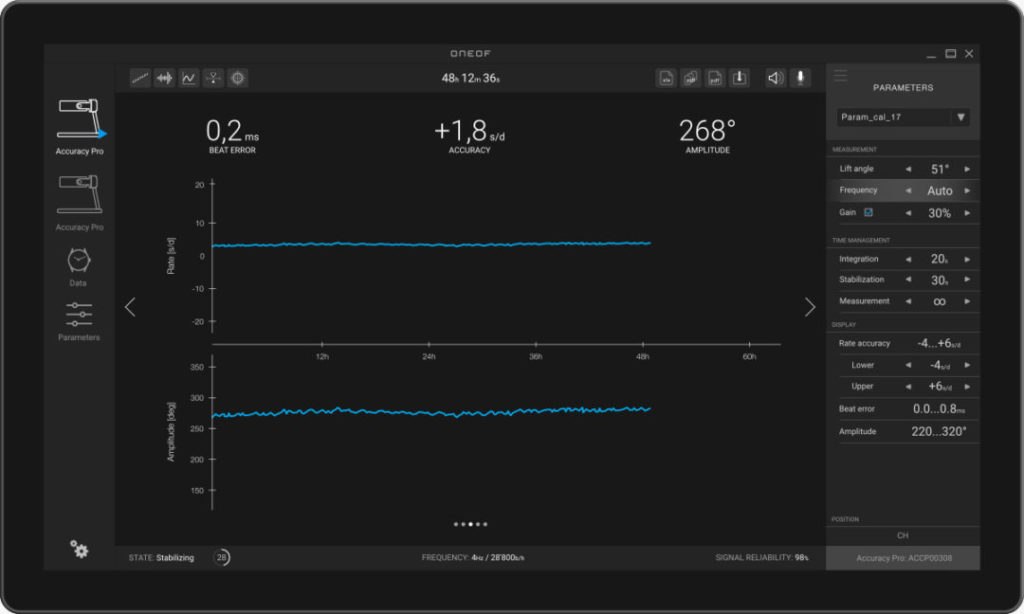
The Graphs
Every second, a new value of both the accuracy and the amplitude is added to cumulative graphs.
It is always interesting to check how these two values vary over time.
Some particular and natural fluctuations might appear, like the impact of defects in the gear train, the drop of the amplitude during the change date, or more generally the variation of the rate accuracy over the entire power reserve of the watch.

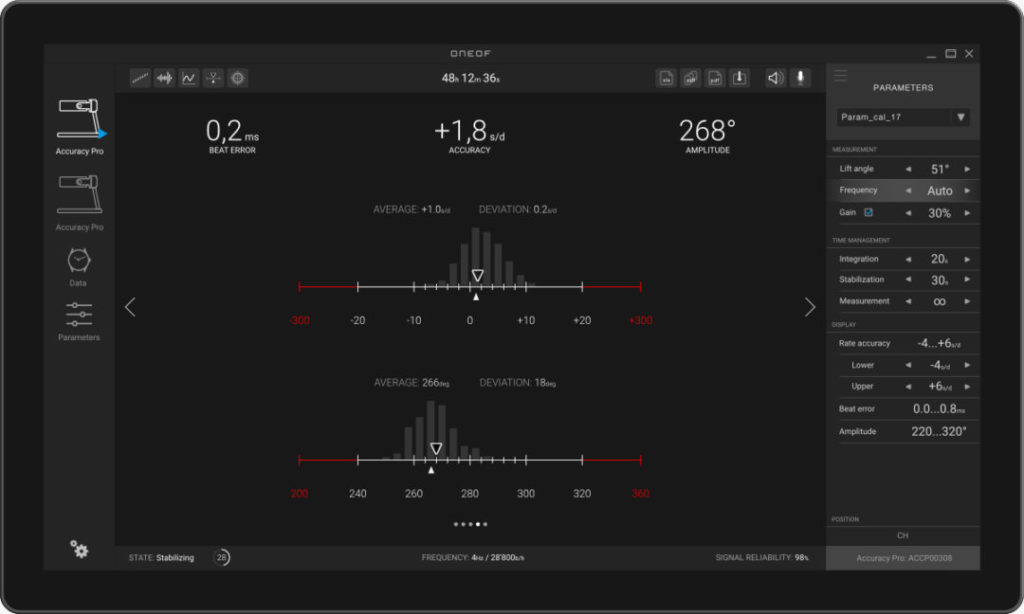
The Dispersion Display
The dispersion display mode represents the stability of both the rate accuracy (on top) and the amplitude (at the bottom) over time. The average and the standard deviation values are computed every second.
Two bar graphs display a clear representation of the variation:
- The upper slider is the instantaneous value.
- The lower slider is the average value over time.
- The grey bars, growing over time, represents the distribution of the results.

The Multi-position Display
This page summarizes the multi-position testing results in two different mode : the tabular data and the radar chart. The positions follow the ISO 3158 (NIHS 95-10) standard, coming from french abbreviations:
- CH = “Cadran Haut” = Dial pointing Up
- CB = “Cadran Bas” = Dial pointing down
- 9H = “9h Haut” = 9.00 pointing Up
- 6H = “6h Haut” = 6.00 pointing Up
- 3H = “3h Haut” = 3.00 pointing Up
- 12H = “12h Haut” = 12.00 pointing Up
The Tabular Data
When measuring a watch in several common positions, this table displays the average results of the rate accuracy, the amplitude and the beat error for each position.
The global average and standard deviation are also computed and displayed.

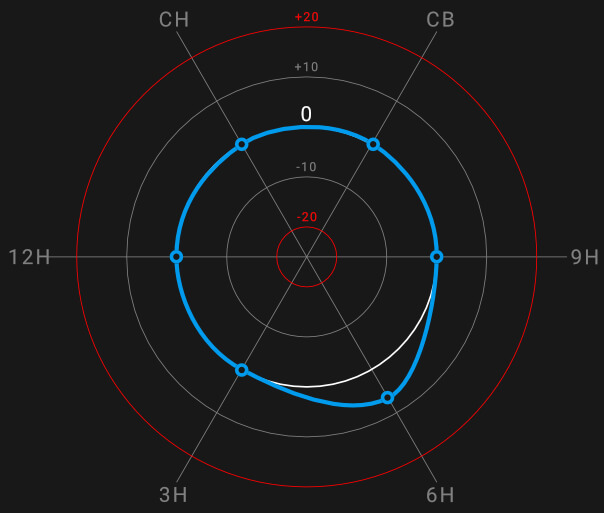
The Radar Chart
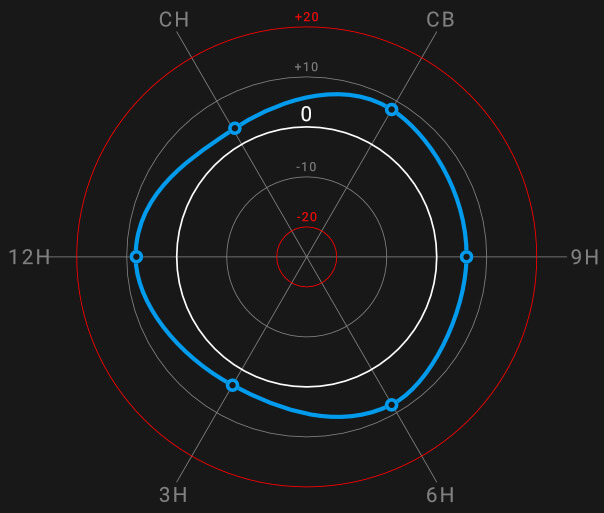
The radar chart is an exclusive display mode of the ONEOF Accuracy apps.
It represents the average accuracy values in the 6 common positions (CH, CB, 9H, 6H, 3H, 12H) in the form of a radar or polar chart. This display is far more easier to read than the standard tabular data. It is the best way to quickly detect if the accuracy of the watch is perfect in all the positions.


Saving & Exporting
The Databases
Measurement results can be easily saved in dedicated databases. Two different databases are implemented in the Accuracy app: local or remote.
The local database runs under Microsoft SQL Server Compact 4.0.
The remote database is compatible with Microsoft SQL Server.
Both databases have the same architecture.
Note: The local and remote databases are not synchronized. It means that a measurement saved in one database will not be automatically saved in the other one.
One watch can have several measurement results. A watch is defined by different fields. Only a name must be filled in. All other fields can stay empty:
- Name
- Brand
- Series
- Type
- Caliber
- Reference
In the database, a measureme
In the database, a measurement result is displayed either with the radar chart mode or the tabular mode.
By clicking on a measurement result, the user retrieves all the other results:
- Graphs
- Dispersion
- Tabular & radar chart
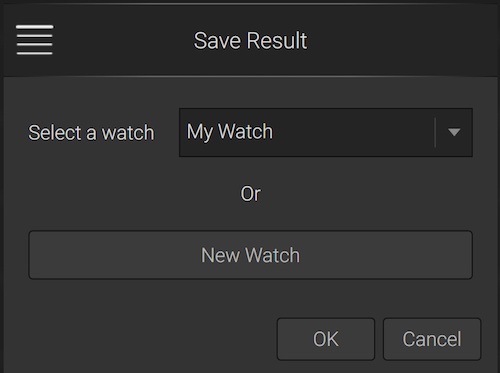
Saving Data
The save button is located on the control bar (top-right of the window).
Measurement results can be saved anytime during the measurement or at the end of a measurement (in case the user set a specific measurement time).
A pop-up appears in which the user can either select a watch (if already created) or create a new one.
When done, the measurements results are automatically added to the watch data.
Exporting Data
The export buttons are located on the control bar (top-right of the window).
The data can be exported from a saved measurement or directly from a running measurement (without stopping it).
There are 3 different possibilities for data export:
- CSV (XLS) file: Raw measurement result – duration, accuracy, amplitude – per second with the watch information and the beat error in the header (if coming from a saved measurement).
- Light PDF report: Contains the measurement information and the tabular data.
- Detailed PDF report: Contains all the measurement information, the tabular data, the radar chart and the graphs.
The Parameters
The Parameters Menu
The measurement parameters are always available through a sliding menu located on the right of the window. It includes a list with the saved user parameters, the current measurement settings, the time management, the display options and the device orientation and serial number.
The Measurement Parameters
The Lift Angle
The lift angle is the angle in degrees [deg] covered by the balance wheel between the first and the third peak of the escapement signal. It is a geometric feature, determined by construction and given by the manufacturer.
In the watchmaking industry, the lift angle is known to be highly inaccurate: between 2 movements of the same production, a variation of +/- 3° of the lift angle is not rare. As a 1° change equates to about 7° change of the amplitude value, that is the reason why the acoustic measurement of the amplitude always remains an estimation.
For the most of the standard watch movements the lift angle is about 51°.
The Frequency
The frequency is the number of oscillations the balance wheel does over time.
The Accuracy Windows app expresses the frequency in beats-per-hour [b/h]. By default, the beating frequency of a watch is automatically detected in less than 2 seconds. The range covers the most common beating frequencies from 2Hz (14’400b/h) to 10Hz (72’000b/h).
The user can manually sets the frequency and thus disable the frequency detection.
The Gain
As all watch signals are different, the Accuracy Pro integrates an AGC, for Automatic Gain Control. By default, the gain is set to automatic which means that weak signals are boosted (Gain > 70%) and strong signals are reduced (Gain < 30%). The AGC is ON until the Measuring State is reached.
By ticking the check box, the user can set a manual gain and thus disable the AGC.
The Time Management
The Integration Time
Due to phenomenons related to the acoustic physics, the rate accuracy must be averaged over a period called the integration time, expressed in seconds [s].
The integration time values cover a range from 2s to 240s.
The lower the time integration, the less stable the measurement. However, a low integration time allows the measurement to show more detailed fluctuations.
Basically, you would use a long integration time (30 or 60s) for inaccurate vintage watches or if you use the Accuracy Pro in a noisy environnement.
If the watch is stable, accurate, and you are doing the measurement in a calm environnement, you can use a lower integration time. However, we highly recommend to always use an integration time higher than 10s.
The Stabilization Time
If set, the stabilization time is a countdown that appears after each change of testing position.
It can be seen as a dead time with no measurement done during that time and serves 2 purposes:
- When a watch changes of position, it can take some time for the balance wheel to reach its full work amplitude.
- When the testing position is changed, noises appear in the signal due to the oscillating mass rotation. Setting a stabilization time can avoid bad results after a change of position.
The Measurement Time
By default, the measurement time is infinite, which means that the measurement will only stop when the watch reaches its power reserve or if it is removed from the sensor.
The user can set a specific measurement up to 92h. If done, the measurement will automatically stop, with a message at the top of the window.
The Warning Limits
This display option highlights all measurement result values in red (accuracy, amplitude or beat error) when they are out of the range set by the user.

The Parameters Database
Just like the results, the measurement and time parameters can be easily saved in both the local or the remote database.
Note: The local and remote databases are not synchronized. It means that a parameter saved in one database will not be automatically saved in the other one.